
Graphic Report Designer
The Graphic Report Designer is used to create and modify reports in the style of a banded report writer. These allow a great deal of customization and support text items with various fonts and font sizes as well as images and graphical elements. Each band of the report represents a portion of the report: the page header, page footer, body, report header and footer, along with headers and footers for each defined group. Superbase NG graphic reports have the extension .sxr and is stored in XML. Essentially, a graphic report contains a print form together with a report definition.
Getting Started with Graphic Reports
By selecting File → New → Report... from the menu, you can start the Graphic Report Designer with an empty report. The width of each band of the initial report will be in the default paper size for your system.
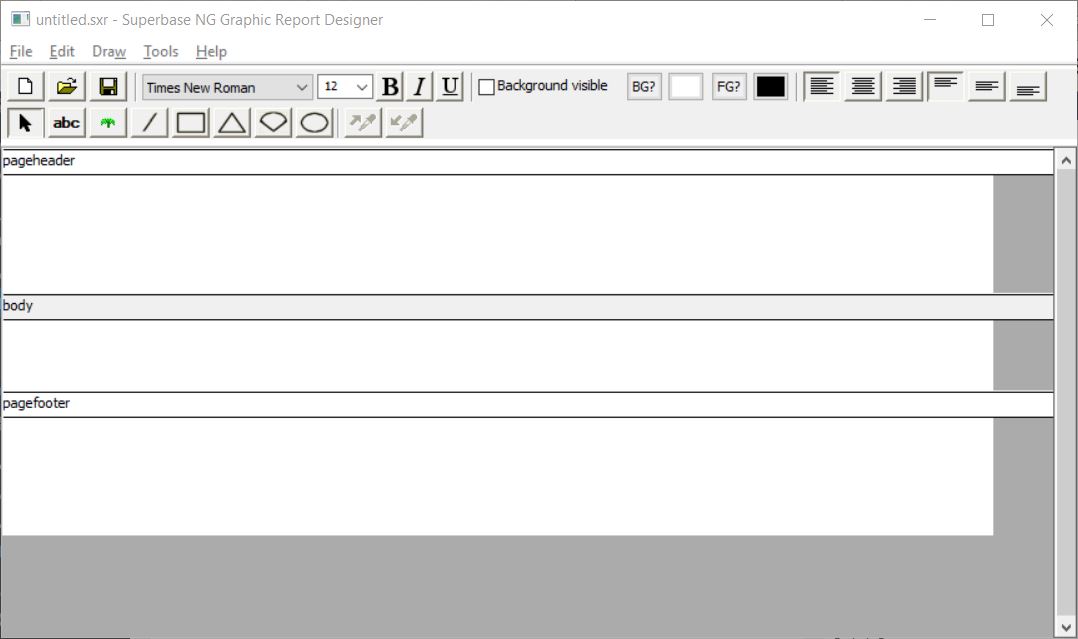
There is a window for each band in the report. Initially, the report is created with a body, page header, and page footer.
| Note | |
|---|---|
| Internally the form is treated as a print form template with each band being a page of that form. When the report is run, a separate internal print form template is created for each page, with the page header being applied to it first. At that point, the current output row from the report is used to populate the controls that are part of the body band in a copy of the body band template. This band is then added to the output in the current offset from the top of the page. As each row is generated by the report engine, it is added to the report page until there would be no room for it and the footer (if defined). At that point, the old page is finalized and a new page template is opened. The page header (if defined) is applied and the output row is then added to the new page. This continues until the last output row is processed. If a report header band is defined, then at the start of the report, the report header band will be output immediately after the page header. The body entries are then output as described earlier, and after the last body entry, if defined, a report footer will be output followed by the page footer. Often it might be desirable to suppress the page header or footer on pages where a report header or report footer will be output and that option is available as will be shown later. |
Both the Quick Report and Graphic Report operate using the baned concept detailed above. The key difference between the two is that in the Quick Report, the definition of the contents of each band is done using the same font and positioning as the items in the body band. There is limited ability to customize the report. A Graphic Report has considerably greater flexibility in terms of what it will look like but currently is only designed to output to the print preview window or directly to a printer.
Graphic Report Designer Tools
All of the same tools that can be used on a print form can also be used on a graphic report. The tools menu in the Graphic Report Designer has some different items as opposed to the Print Form Designer. It contains the following items:
- Z-Order; used to affect the stacking order of controls on the output form
- Headers, Footers, and Properties; used to select which header and footer bands are displayed
- Groups; used to define the way the output is grouped, including enabling group header and footer bands.
- Order; allows the sort order for the report to be defined
- Filter; allows us to set the filter conditions and define how multiple tables are linked together (File Links)
- Test Report; allows the entire report to be run, including any options that have been selected.
A Basic Graphic Report
In the next few sections we will be working with the customer database supplied as part of the SIMPOL Business this should be found under C:\Users\Public\Documents\SIMPOL Business. For our initial report, we will create a customer list, grouped by country, last name, and first name. For each country, we will output the number of entries in that group as well as the total number of entries.
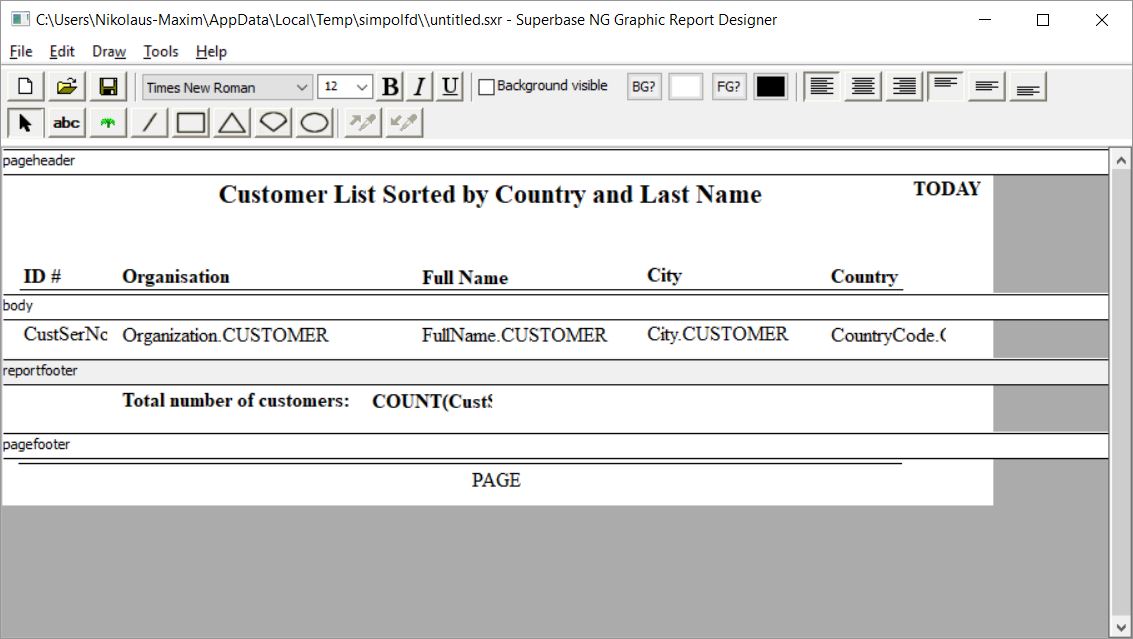
Starting with an empty report we will want to add a Report Footer
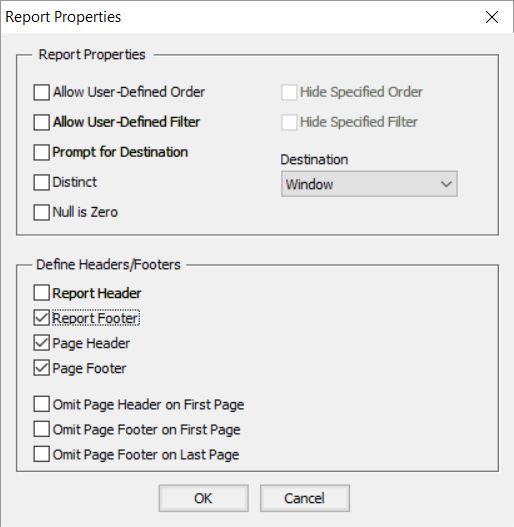
The Report Properties window (above) consists of two sections: the first containing options which affect the running of the report (Report Properties) and the second which allows us to include and omit headers and footers. Allow User-Defined Order and Allow User-Defined Filter, if selected, will cause the report engine the user the order and filter dialogue boxes so they can modify the content before the report is run. The Link button in the filter dialogue will not be available to the user in this mode. If Hide Specified Order or Hide Specified Filter are enabled then the built-in filter and order clauses will not be displayed. Distinct suppresses multiple identical output rows. Null is Zero does exactly that any numeric field containing a null value will be set to 0 in the output.
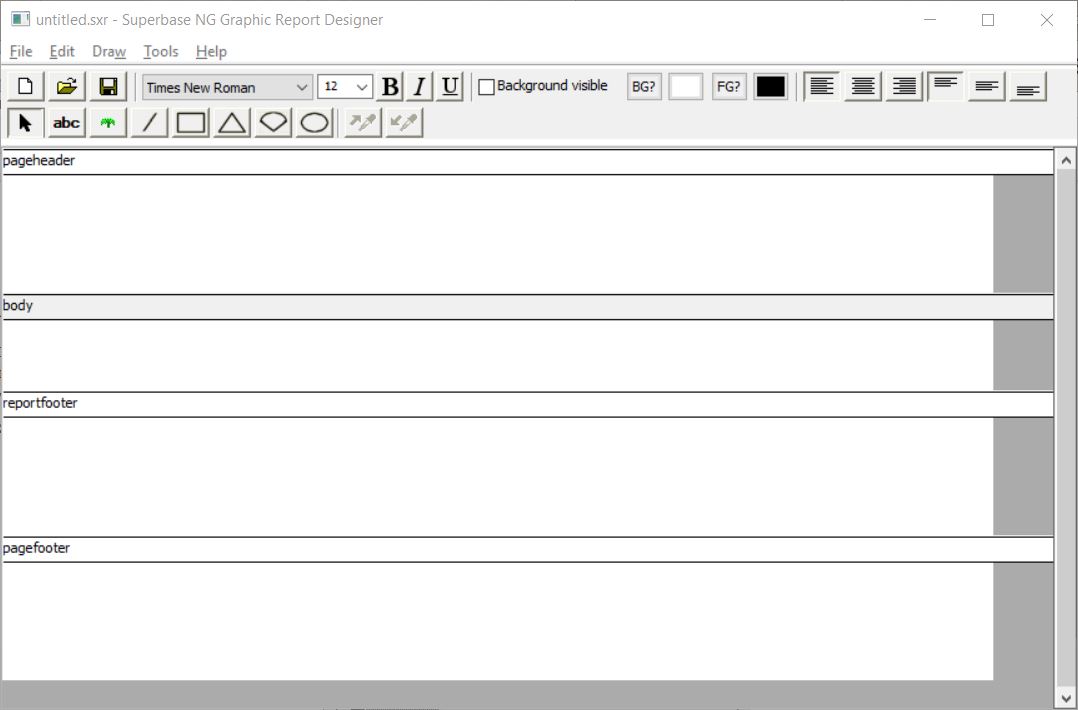
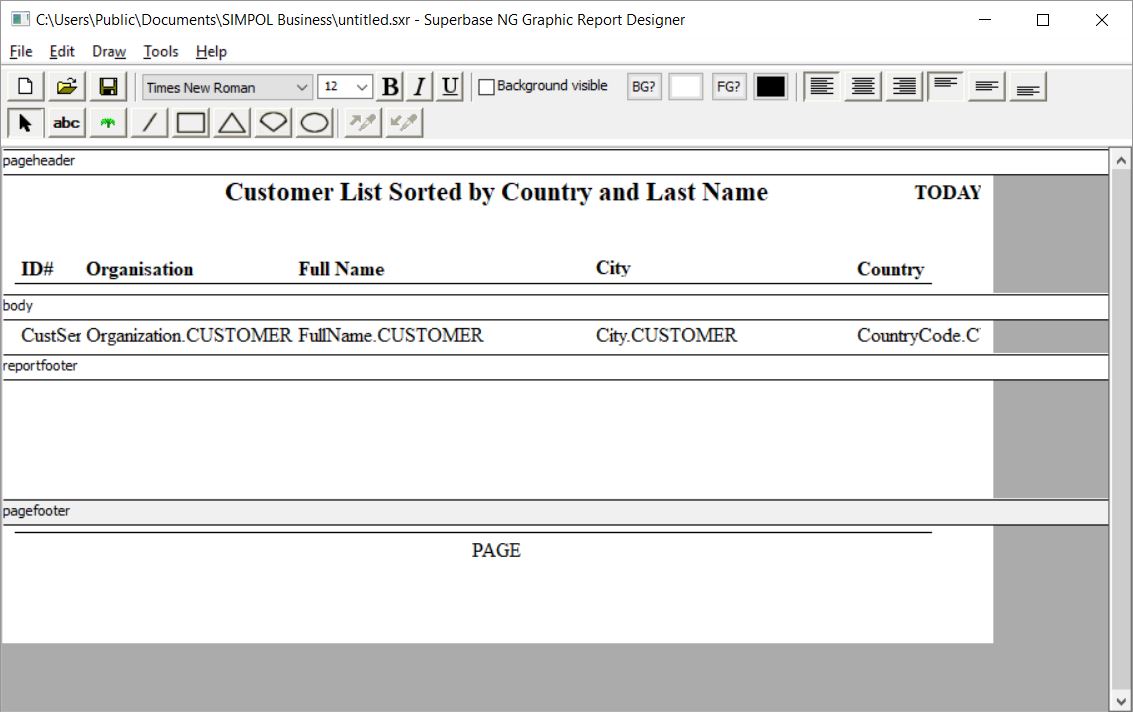
Adding items to the report bands is identical to adding them in print form. The body pane is for the fields from the report that make up the actual core output. the report footer pane is where information that should go at the end of the report should go (i.e. aggregate calculations/totals).
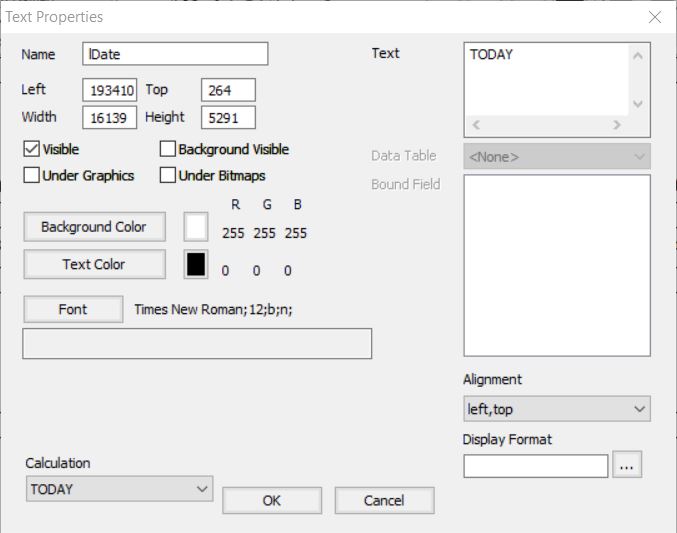
Next, we want to add today’s date as a calculation to the page header, to do this create a text box, and in the calculation drop down select TODAY (the calculations available change in each band), furthermore, it is advised to rename this to lDate
Using this same approach add a page number to the page footer
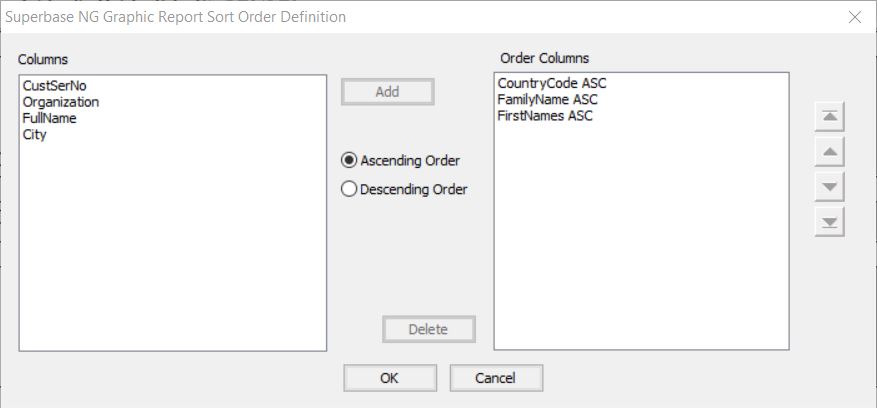
Now that we have completed the initial report we will add a sort order. We want to sort by Last and First name but the columns used in the sort order must be present in the report. This can be done by adding them and deselecting Visible.
| Note | |
|---|---|
| A later version of the designer will add a feature that places a box around each control, making it easier to find and select them. |
Now we have done this we can go and define our sort order like so:
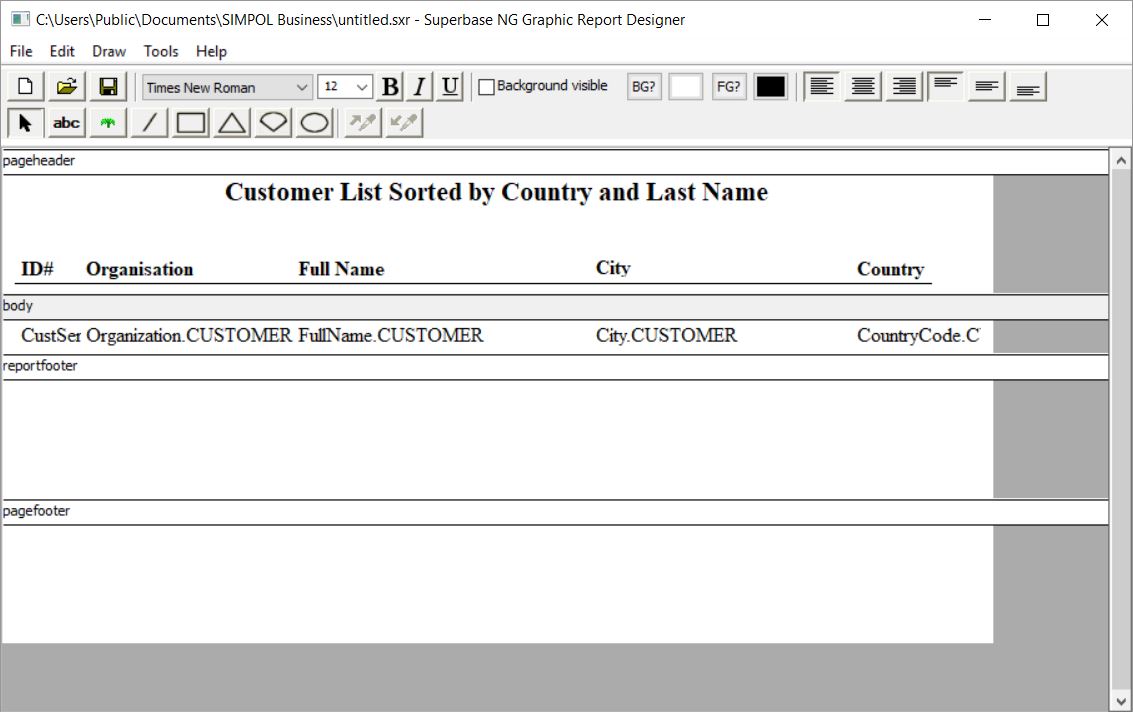
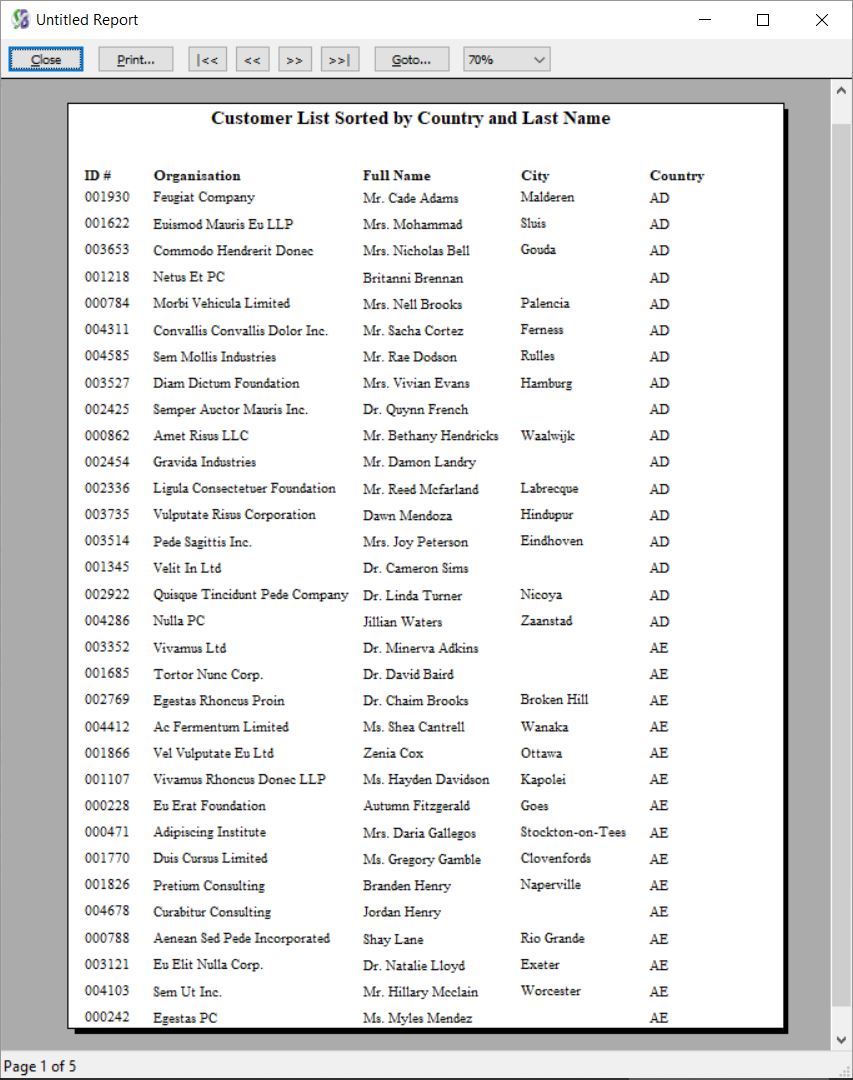
And then using the Test Print function we get a report that should look something like this
Developing the Customer Report Further
So far the report produces a list, but it would be useful if it gave us a total for the number of customers in the report. To do this we add a calculation in the report footer page. To do this draw a text box, select the field you want to count and then in the Aggregate Type drop-down select COUNT.
After running this report there are 157 pages output, on the final page the total number of customers is shown in the report footer
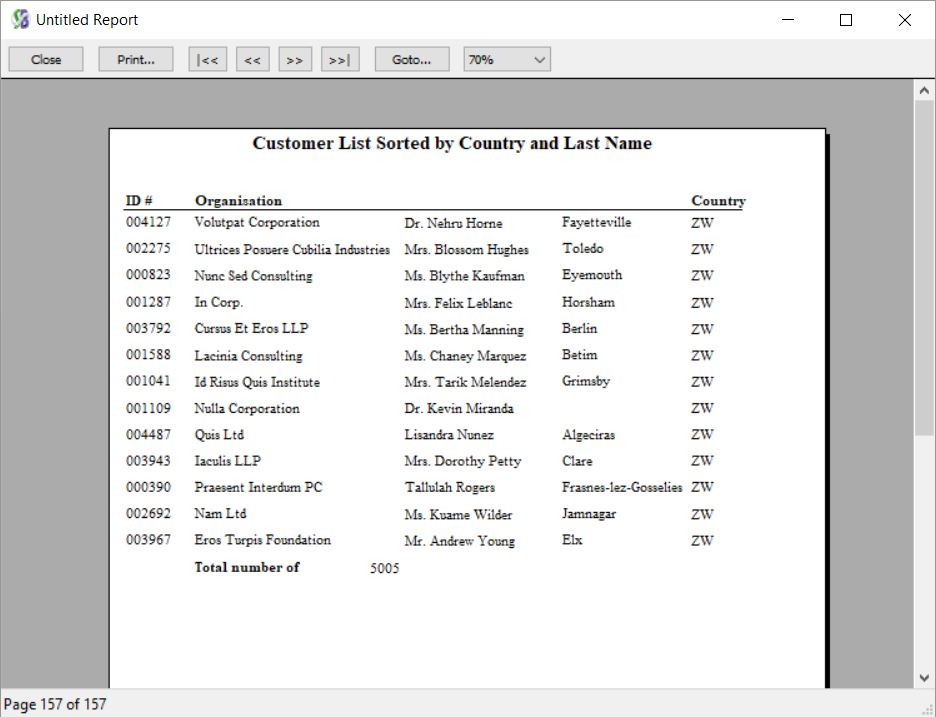
If the total number is not displayed like this go back into the count and make sure the Use Required Space Only option is enabled